| Table 17.1 : CONSUMER PRICE INDEX, 2006- 2011 | |||||||||||||||||||||
| (Index - base: June 2004=100) | |||||||||||||||||||||
| Major Groups - Maldives | Percentage change over previous year | ||||||||||||||||||||
| Base weights | 2006 | 2007 | 2008 | 2009 | 2010 * | 2011 | 2007 | 2008 | 2009 | 2010 * | 2011 | ||||||||||
| Food and beverages including fish | 33.3 | 108.2 | 125.5 | 147.8 | 150.0 | 157.9 | 188.8 | 16.0 | 17.8 | 1.5 | 5.2 | 19.6 | |||||||||
| Food and beverages excluding fish | 28.8 | 111.6 | 123.5 | 147.2 | 153.0 | 160.7 | 180.7 | 10.7 | 19.2 | 3.9 | 5.1 | 12.4 | |||||||||
| Fish Index | 4.6 | 86.7 | 137.8 | 151.8 | 131.5 | 140.7 | 239.9 | 58.9 | 10.1 | -13.3 | 7.0 | 70.5 | |||||||||
| Tobacco | 2.8 | 109.0 | 111.6 | 117.7 | 115.3 | 113.5 | 145.2 | 2.3 | 5.6 | -2.1 | -1.5 | 27.9 | |||||||||
| Clothing and footwear | 6.0 | 101.8 | 105.8 | 109.0 | 112.2 | 114.8 | 128.4 | 3.9 | 3.0 | 3.0 | 2.3 | 11.9 | |||||||||
| Housing, water, electricity, gas and fuel | 19.5 | 109.2 | 113.8 | 126.9 | 136.5 | 145.7 | 150.4 | 4.2 | 11.5 | 7.6 | 6.7 | 3.2 | |||||||||
| Actual rentals from housing | 7.2 | 108.7 | 113.2 | 125.8 | 143.8 | 153.0 | 161.1 | 4.2 | 11.1 | 14.3 | 6.4 | 5.3 | |||||||||
| Furnishing, household equipment & routine maintenance | 5.3 | 108.2 | 114.3 | 123.1 | 135.0 | 143.6 | 157.1 | 5.6 | 7.7 | 9.6 | 6.4 | 9.4 | |||||||||
| Health | 5.4 | 111.2 | 119.3 | 139.4 | 142.9 | 155.8 | 170.0 | 7.2 | 16.8 | 2.5 | 9.0 | 9.1 | |||||||||
| Transport | 5.1 | 120.8 | 124.2 | 148.8 | 149.5 | 154.8 | 175.5 | 2.8 | 19.8 | 0.5 | 3.6 | 13.4 | |||||||||
| Communication | 5.8 | 74.7 | 68.1 | 66.2 | 65.9 | 66.0 | 66.0 | -8.9 | -2.8 | -0.5 | 0.1 | 0.0 | |||||||||
| Recreation and culture | 4.9 | 95.0 | 93.6 | 90.8 | 94.0 | 98.7 | 101.1 | -1.5 | -3.0 | 3.5 | 5.0 | 2.4 | |||||||||
| Education | 3.1 | 103.1 | 107.5 | 109.1 | 135.0 | 144.7 | 167.2 | 4.3 | 1.5 | 23.7 | 7.2 | 15.5 | |||||||||
| Hotels, cafés and restaurants | 0.8 | 102.1 | 119.2 | 137.8 | 141.3 | 145.9 | 168.7 | 16.7 | 15.6 | 2.6 | 3.2 | 15.6 | |||||||||
| Miscellaneous goods and services | 7.9 | 100.9 | 105.2 | 110.1 | 116.6 | 122.5 | 133.0 | 4.3 | 4.6 | 6.0 | 5.0 | 8.6 | |||||||||
| Religious activity | 0.1 | 100.0 | 100.0 | 100.0 | 100.0 | 100.0 | 100.0 | 0.0 | 0.0 | 0.0 | 0.0 | 0.0 | |||||||||
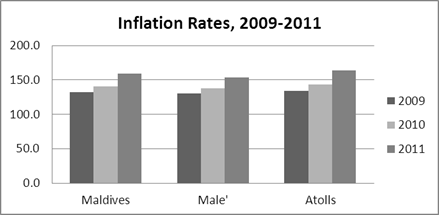
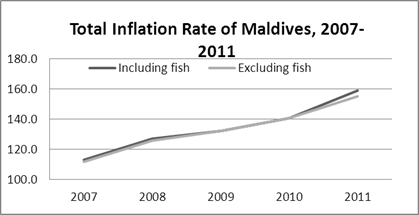
| Total | 100.0 | 105.4 | 113.2 | 127.0 | 132.1 | 140.8 | 158.9 | 7.4 | 12.3 | 4.0 | 6.6 | 12.8 | |||||||||
| Index excluding fish | 95.4 | 106.3 | 112.0 | 125.8 | 132.1 | 140.8 | 155.0 | 5.4 | 12.4 | 5.0 | 6.6 | 10.1 | |||||||||
| Table 17.1 ( continued ) | |||||||||||||||||||||
| Major Groups - Male' | Percentage change over previous year | ||||||||||||||||||||
| Base weights | 2006 | 2007 | 2008 | 2009 | 2010 | 2011 | 2007 | 2008 | 2009 | 2010 | 2011 | ||||||||||
| Food and beverages including fish | 13.4 | 109.0 | 126.6 | 150.8 | 151.6 | 162.9 | 195.4 | 16.2 | 19.1 | 0.5 | 7.5 | 19.9 | |||||||||
| Food and beverages excluding fish | 11.0 | 113.1 | 124.9 | 151.5 | 156.0 | 167.5 | 188.6 | 10.4 | 21.3 | 2.9 | 7.4 | 12.6 | |||||||||
| Fish Index | 2.4 | 90.2 | 134.6 | 147.5 | 131.7 | 141.9 | 226.0 | 49.2 | 9.6 | -10.7 | 7.7 | 59.3 | |||||||||
| Tobacco | 0.9 | 108.3 | 109.6 | 113.4 | 111.3 | 111.0 | 141.2 | 1.2 | 3.4 | -1.8 | -0.3 | 27.2 | |||||||||
| Clothing and footwear | 2.5 | 104.7 | 103.2 | 105.9 | 109.3 | 112.5 | 127.0 | -1.4 | 2.6 | 3.2 | 3.0 | 12.9 | |||||||||
| Housing, water, electricity, gas and fuel | 12.3 | 105.6 | 109.6 | 121.7 | 131.2 | 141.1 | 145.2 | 3.8 | 11.0 | 7.8 | 7.6 | 2.9 | |||||||||
| Actual rentals from housing | 7.2 | 108.7 | 113.2 | 125.8 | 143.8 | 153.0 | 159.9 | 4.2 | 11.1 | 14.3 | 6.4 | 4.5 | |||||||||
| Furnishing, household equipment & routine maintenance | 2.9 | 107.1 | 112.6 | 116.7 | 129.4 | 137.2 | 142.9 | 5.1 | 3.6 | 10.9 | 6.0 | 4.2 | |||||||||
| Health | 2.8 | 112.7 | 123.0 | 147.8 | 151.2 | 158.2 | 174.9 | 9.2 | 20.2 | 2.3 | 4.7 | 10.6 | |||||||||
| Transport | 2.9 | 119.8 | 125.5 | 152.1 | 153.6 | 158.7 | 180.5 | 4.7 | 21.1 | 1.0 | 3.3 | 13.7 | |||||||||
| Communication | 3.8 | 70.6 | 64.1 | 61.8 | 61.3 | 61.5 | 61.6 | -9.2 | -3.6 | -0.7 | 0.2 | 0.2 | |||||||||
| Recreation and culture | 2.1 | 88.6 | 90.2 | 84.1 | 88.3 | 93.4 | 91.4 | 1.8 | -6.8 | 5.0 | 5.7 | -2.1 | |||||||||
| Education | 1.5 | 106.7 | 109.2 | 111.2 | 150.2 | 164.4 | 194.5 | 2.3 | 1.8 | 35.1 | 9.4 | 18.3 | |||||||||
| Hotels, cafés and restaurants | 0.8 | 102.1 | 119.2 | 137.8 | 141.3 | 145.9 | 168.7 | 16.7 | 15.6 | 2.6 | 3.2 | 15.6 | |||||||||
| Miscellaneous goods and services | 3.0 | 101.3 | 103.7 | 110.2 | 118.1 | 123.9 | 133.1 | 2.3 | 6.3 | 7.1 | 4.9 | 7.4 | |||||||||
| Religious activity | 0.1 | 100.0 | 100.0 | 100.0 | 100.0 | 100.0 | 100.0 | 0.0 | 0.0 | 0.0 | 0.0 | 0.0 | |||||||||
| Total | 48.9 | 104.1 | 111.2 | 124.6 | 130.2 | 138.2 | 153.8 | 6.8 | 12.0 | 4.5 | 6.1 | 11.3 | |||||||||
| Index excluding fish | 46.5 | 104.8 | 110.0 | 123.4 | 130.1 | 138.0 | 150.0 | 4.9 | 12.2 | 5.5 | 6.1 | 8.7 | |||||||||
| Table 17.1 ( continued ) | |||||||||||||||||||||
| Major Groups - Atolls | Percentage change over previous year | ||||||||||||||||||||
| Base weights | 2006 | 2007 | 2008 | 2009 | 2010 * | 2011 | 2007 | 2008 | 2009 | 2010 * | 2011 | ||||||||||
| Food and beverages including fish | 19.9 | 107.7 | 124.8 | 145.8 | 148.9 | 155.1 | 185.1 | 15.9 | 16.8 | 2.1 | 4.2 | 19.3 | |||||||||
| Food and beverages excluding fish | 17.8 | 110.7 | 122.8 | 144.4 | 151.0 | 157.0 | 176.6 | 10.9 | 17.6 | 4.5 | 4.0 | 12.5 | |||||||||
| Fish Index | 2.1 | 82.7 | 141.3 | 156.6 | 131.3 | 139.4 | 255.4 | 70.8 | 10.8 | -16.2 | 6.1 | 83.3 | |||||||||
| Tobacco | 1.8 | 109.4 | 112.5 | 120.0 | 117.3 | 114.8 | 147.3 | 2.9 | 6.6 | -2.2 | -2.2 | 28.3 | |||||||||
| Clothing and footwear | 3.5 | 99.8 | 108.0 | 111.3 | 117.2 | 118.4 | 129.7 | 8.2 | 3.0 | 5.3 | 1.0 | 9.5 | |||||||||
| Housing, water, electricity, gas and fuel | 7.2 | 115.5 | 121.1 | 136.7 | 146.1 | 154.6 | 157.3 | 4.8 | 12.9 | 6.9 | 5.8 | 1.7 | |||||||||
| Furnishing, household equipment & routine maintenance | 2.4 | 109.3 | 116.7 | 132.3 | 143.2 | 148.9 | 160.9 | 6.8 | 13.4 | 8.2 | 4.0 | 8.1 | |||||||||
| Health | 2.7 | 108.3 | 110.3 | 124.7 | 128.8 | 169.3 | 185.0 | 1.8 | 13.1 | 3.3 | 31.4 | 9.3 | |||||||||
| Transport | 2.1 | 122.1 | 122.1 | 144.0 | 144.5 | 150.2 | 170.4 | 0.0 | 18.0 | 0.3 | 3.9 | 13.5 | |||||||||
| Communication | 2.0 | 82.7 | 75.8 | 74.7 | 74.7 | 74.7 | 74.4 | -8.3 | -1.5 | 0.0 | 0.0 | -0.3 | |||||||||
| Recreation and culture | 2.8 | 99.8 | 96.3 | 96.0 | 91.7 | 93.2 | 97.9 | -3.5 | -0.3 | -4.5 | 1.6 | 5.1 | |||||||||
| Education | 1.6 | 99.7 | 105.4 | 107.3 | 116.0 | 119.9 | 123.0 | 5.6 | 1.8 | 8.1 | 3.4 | 2.5 | |||||||||
| Hotels, cafés and restaurants | - | - | - | - | - | - | - | - | - | - | |||||||||||
| Miscellaneous goods and services | 5.0 | 100.6 | 106.0 | 109.8 | 115.5 | 121.4 | 132.5 | 5.4 | 3.6 | 5.2 | 5.0 | 9.2 | |||||||||
| Religious activity | - | - | - | - | - | - | - | - | - | - | |||||||||||
| Total | 51.1 | 106.6 | 115.1 | 129.4 | 133.9 | 143.3 | 163.8 | 7.9 | 12.5 | 3.5 | 7.0 | 14.3 | |||||||||
| Index excluding fish | 49.0 | 107.7 | 113.9 | 128.2 | 134.0 | 143.5 | 159.8 | 5.8 | 12.5 | 4.5 | 7.1 | 11.3 | |||||||||
| Source: Department of National Planning | |||||||||||||||||||||
| Note: * Revised figure | |||||||||||||||||||||
|
|||||||||||||||||||||